The RTX 5090 is the fastest GeForce card NVIDIA makes.
The RTX 5090 is the fastest GeForce card NVIDIA makes. It is also a desktop card: large, hot, and rated to pull up to 600 watts. Most servers cannot fit one, and the ones that physically can will throttle it the moment a job runs for longer than a benchmark loop.
We built the Pro Maestro GQ-A to hold four of them and keep them at full clocks under sustained load. It is one of the most exclusive GPU servers available in India, built and supported by ProX PC, and configured to a spec you will not find off the shelf. Then we benchmarked it across the three workloads it is actually bought for: GPU rendering, fluid simulation, and AI inference. We also measured the parts most spec sheets skip, the CPU, wall power, and thermals under combined load.
This is the full report. Nothing is rounded away to flatter the result, and the weak numbers are here alongside the strong ones, because for this audience the caveats are the point.
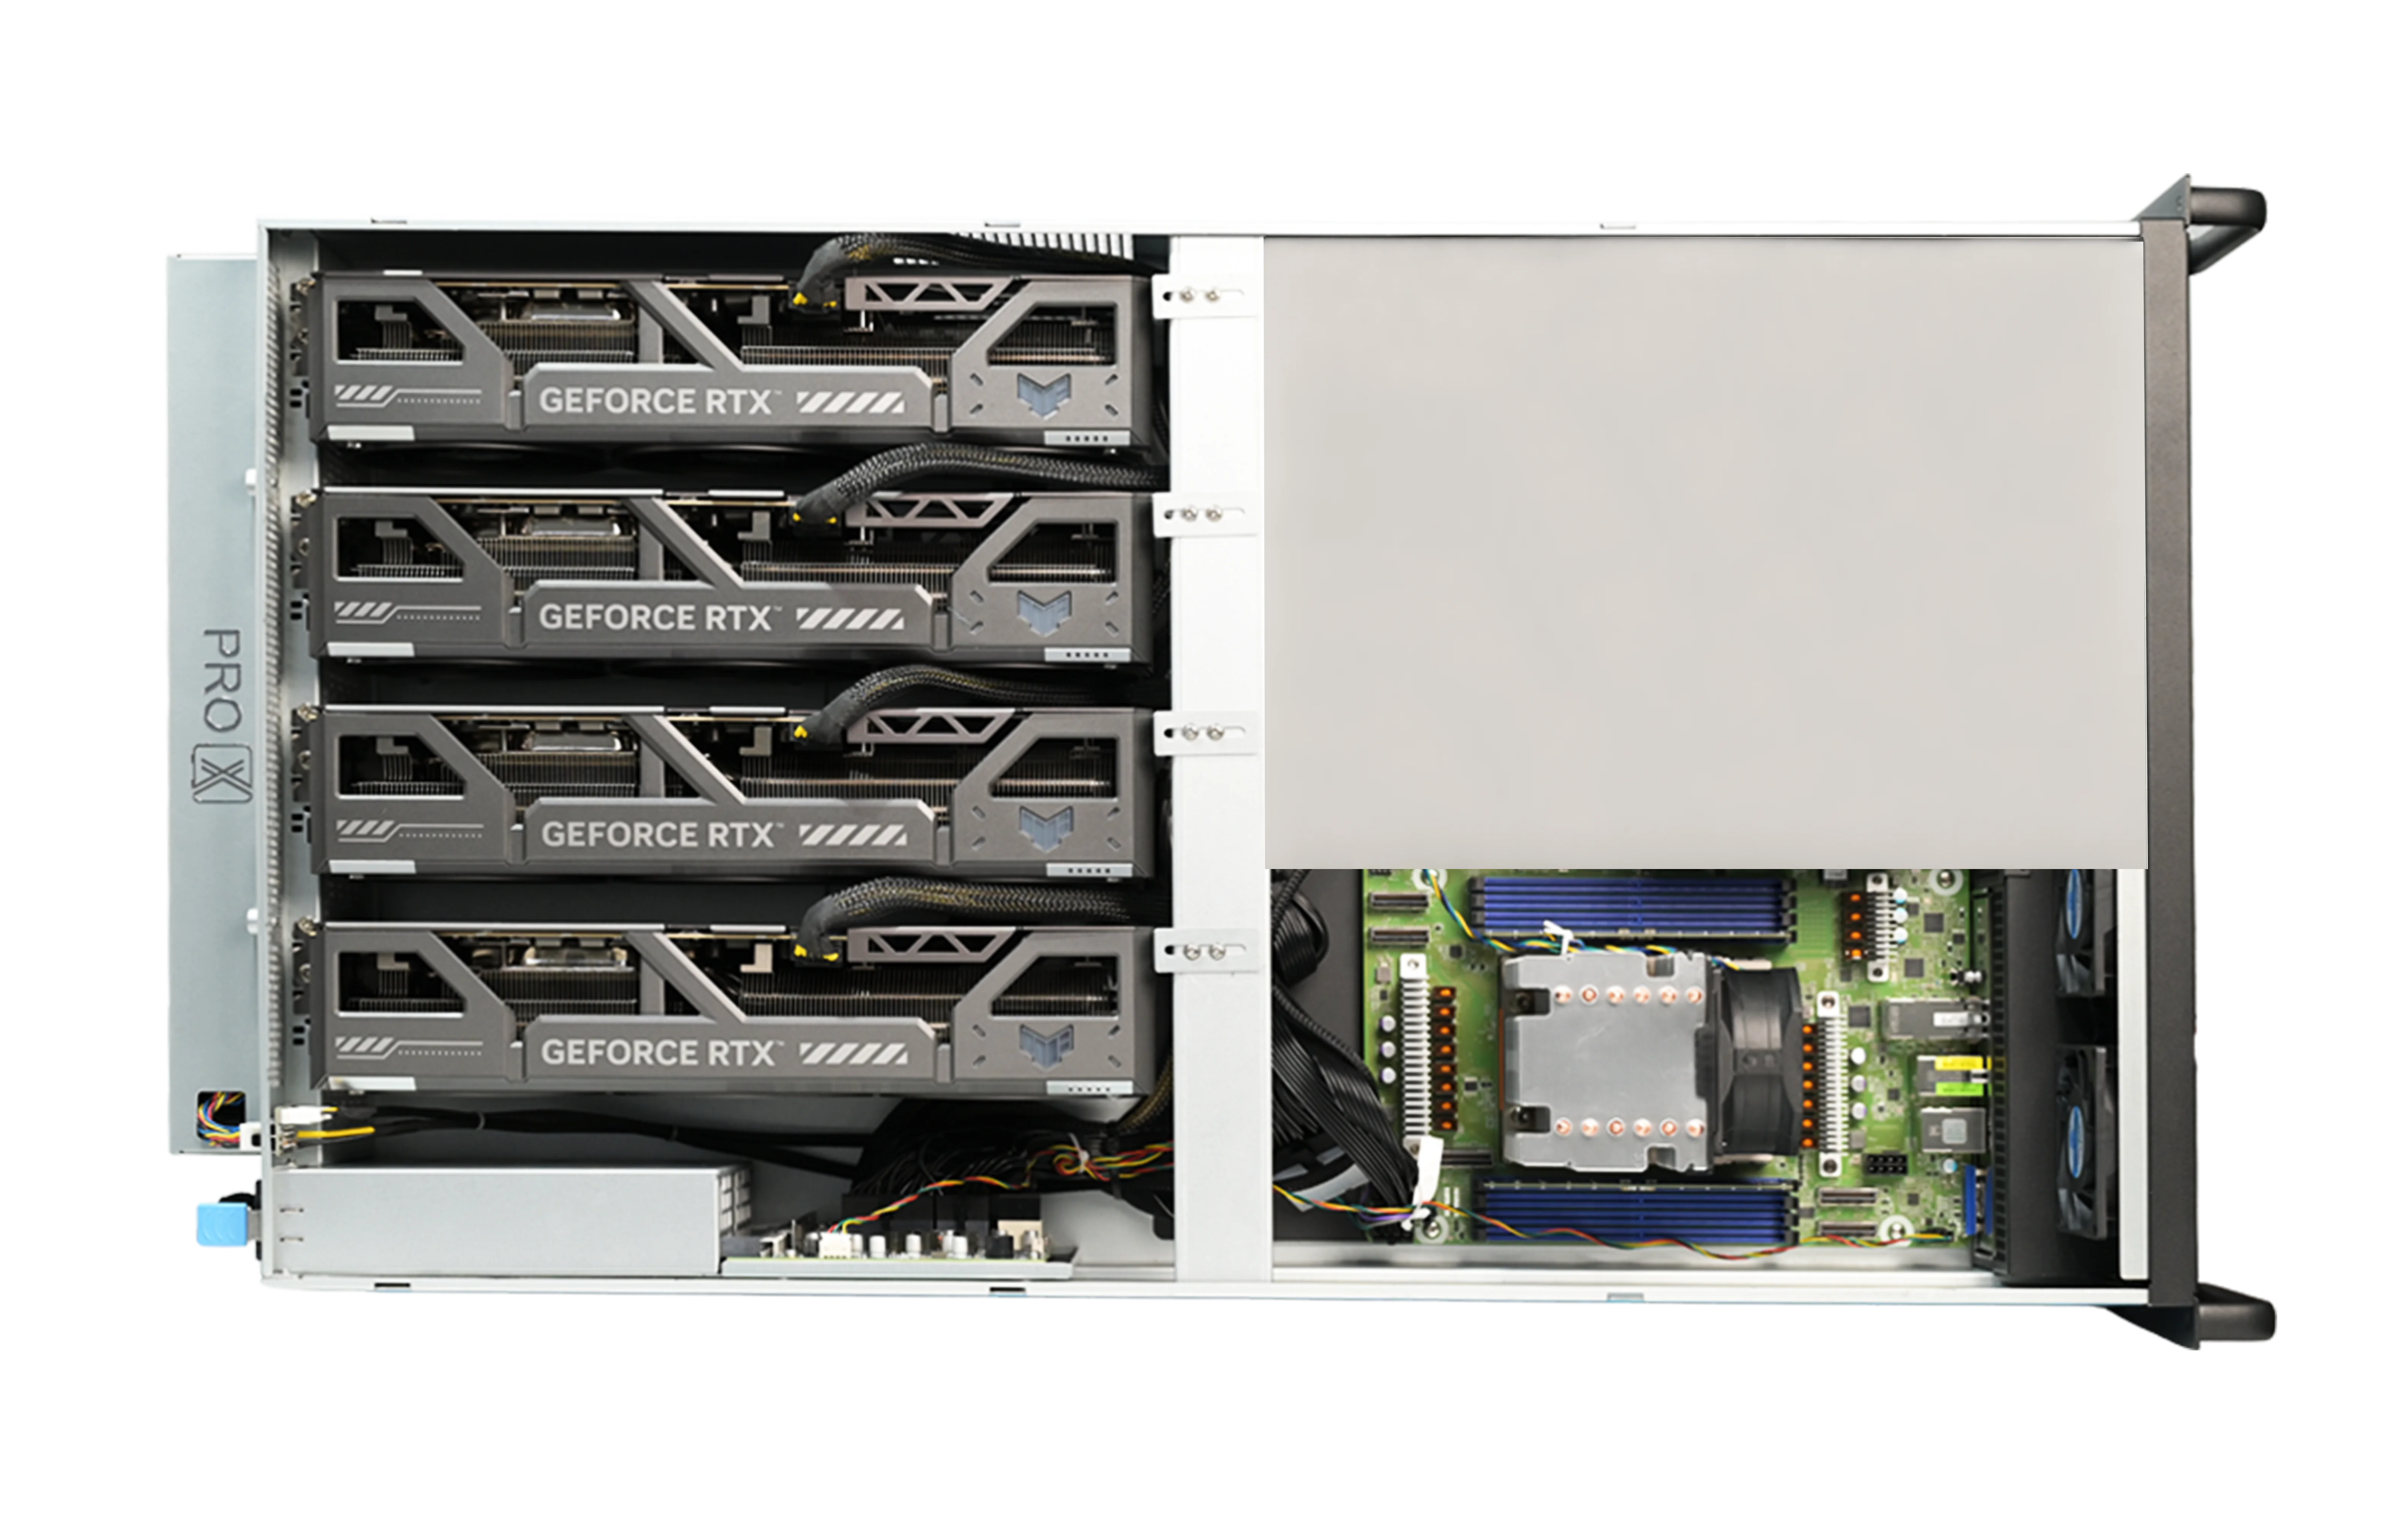
The Pro Maestro GQ-A is a 4U rackmount server built around full-size GeForce cards. It is configurable across a range; the table below is what the platform supports, and the section after it is the exact unit we benchmarked.
| Component | Supported |
|---|---|
| Form factor | 4U rackmount server, engineered around full-size GeForce cards |
| GPUs | Up to 4x full-size GeForce cards, each slot rated 600 W power and airflow |
| CPU | Up to 192 cores |
| Memory | Up to 4 TB DDR5 ECC |
| Storage bays | 5 hot-swap |
| Networking | Up to 400 Gbit |
| Power | Redundant (1+1) PSUs |
| Management | Full remote / out-of-band |
Every benchmark in this report was produced on this exact configuration.
| Component | As tested |
|---|---|
| GPUs | 4x NVIDIA GeForce RTX 5090, 32 GB GDDR7 each (128 GB combined) |
| CPU | AMD EPYC 9554, 64 cores / 128 threads, ~3.76 GHz |
| Memory | 256 GB DDR5 ECC (251.4 GiB usable) |
| OS storage | 2x ~4 TB NVMe in RAID 0 (7.4 TB usable, root volume) |
| Scratch storage | 2x ~1 TB NVMe in RAID 0 (1.9 TB usable, mounted at /mnt/nvme0) |
The problem is not raw GPU power, it is heat and clearance over time. A 575 W card in a slot meant for a 300 W card runs into two walls: tight slot spacing crowds the coolers so they starve each other of air, and a general-purpose server cannot move enough air to hold four of them at full clocks. The result is thermal throttling, where the card quietly drops frequency to survive, and your rendered frames or training steps slow down without an error to tell you why.
The GQ-A is designed so each of the four slots gets power delivery and directed airflow sized for a sustained 600 W draw. The thermal results later in this report show whether that holds. It does.
Every result below was produced on the same machine, same software stack, in a single test campaign.
| Software | Version |
|---|---|
| OS | Ubuntu, Linux kernel 6.8.0-124-generic |
| GPU driver | 595.58.03 |
| CUDA | 13.2 |
| OctaneBench | 2025.2.1 (build 14020100), hardware ray tracing enabled |
| V-Ray | V-Ray Benchmark (CUDA, RTX, and CPU modes) |
| CFD | FluidX3D, OpenCL C 3.0 backend |
| Inference | vLLM, tensor parallel across all 4 GPUs, OpenAI-compatible endpoint |
| CPU test | PassMark PerformanceTest Linux 11.0.1004 |
| Ambient | Open test bench, roughly 24 °C |
Before the numbers, the honest framing, because the obvious comparison is to an H200.
One H200 GPU costs roughly what six RTX 5090s cost. The four cards in this server come in well under the price of a single H200. (GPU pricing moves week to week and varies by region and vendor, so treat that ratio as a current-market guide, not a fixed law.)
The H200 wins on several real axes and we will not pretend otherwise. It carries 141 GB of HBM3e on one card, far more memory bandwidth, NVLink for fast GPU-to-GPU communication, and strong FP64 performance. If you train large models, run a single model that needs more than 32 GB per card, or run tightly coupled jobs where the GPUs must talk to each other constantly, the H200 or our RTX Pro 6000 servers are the right tool, and we build those too. (Know more about Pro6000 or H200 4GPU Server / 10GPU Server)
What four 5090s give you instead, for less than the price of one H200, is over 87,000 CUDA cores against roughly 17,000, and 128 GB of VRAM spread across four independent cards. That last word matters. These cards do not share memory over NVLink, so the advantage shows up on workloads that run in parallel across separate GPUs rather than as one giant job split across them. Rendering and multi-user inference are exactly that shape. The CUDA core comparison is scoped to FP8 and graphics work; it is not a claim about FP64 or memory-bound training, where the architectures differ.
So we benchmarked the workloads that actually fit this shape.
The first question anyone asks about a multi-GPU system is whether the second, third, and fourth cards earn their place, or whether the design chokes them. We ran OctaneBench at every GPU count to find out.
| GPUs | Total score | Scaling vs 1 GPU |
|---|---|---|
| v1 | 1,739 | 1.00x |
| 2 | 3,455 | 1.99x |
| 3 | 5,158 | 2.97x |
| 4 | 6,853 | 3.94x |
Four cards reach 3.94x the single-card score. Near-linear scaling like this means the design loses almost nothing to thermals or power limits as cards are added; each GPU is doing close to its full standalone work. For a render farm, this is the number that matters, because it tells you four cards in one system behave like four cards, not like three-and-a-half.
OctaneBench scores four scenes (Interior, Idea, ATV, Box), each across three kernels (info channels, direct lighting, path tracing). The columns below are the raw OctaneBench output: Ms/s is millions of samples per second measured on this hardware, ×GTX 980 is the ratio against OctaneBench's reference GTX 980, Weight is the fixed importance OctaneBench assigns each kernel (info channels 10, direct lighting 40, path tracing 50), and Score is the weighted contribution (ratio × weight ÷ 4 scenes). The totals above are the sum of every Score row.
| Scene | Kernel | Ms/s | ×GTX 980 | Weight | Score |
|---|---|---|---|---|---|
| Interior | Info channels | 1,338.5 | 25.98 | 10 | 64.95 |
| Interior | Direct lighting | 316.7 | 17.79 | 40 | 177.89 |
| Interior | Path tracing | 147.2 | 17.23 | 50 | 215.40 |
| Idea | Info channels | 1,399.9 | 16.28 | 10 | 40.70 |
| Idea | Direct lighting | 301.2 | 14.31 | 40 | 143.07 |
| Idea | Path tracing | 261.0 | 13.47 | 50 | 168.36 |
| ATV | Info channels | 1,299.7 | 41.40 | 10 | 103.51 |
| ATV | Direct lighting | 285.0 | 18.74 | 40 | 187.36 |
| ATV | Path tracing | 249.2 | 19.29 | 50 | 241.11 |
| Box | Info channels | 1,465.1 | 22.28 | 10 | 55.71 |
| Box | Direct lighting | 227.8 | 16.46 | 40 | 164.62 |
| Box | Path tracing | 189.7 | 14.10 | 50 | 176.26 |
| Scene | Kernel | Ms/s | ×GTX 980 | Weight | Score |
|---|---|---|---|---|---|
| Interior | Info channels | 2,667.9 | 51.78 | 10 | 129.46 |
| Interior | Direct lighting | 632.2 | 35.52 | 40 | 355.17 |
| Interior | Path tracing | 290.2 | 33.99 | 50 | 424.83 |
| Idea | Info channels | 2,775.5 | 32.28 | 10 | 80.69 |
| Idea | Direct lighting | 599.8 | 28.50 | 40 | 284.96 |
| Idea | Path tracing | 518.4 | 26.75 | 50 | 334.39 |
| ATV | Info channels | 2,577.8 | 82.12 | 10 | 205.30 |
| ATV | Direct lighting | 566.8 | 37.26 | 40 | 372.62 |
| ATV | Path tracing | 494.7 | 38.29 | 50 | 478.64 |
| Box | Info channels | 2,912.3 | 44.29 | 10 | 110.74 |
| Box | Direct lighting | 452.5 | 32.69 | 40 | 326.94 |
| Box | Path tracing | 378.1 | 28.11 | 50 | 351.40 |
| Scene | Kernel | Ms/s | ×GTX 980 | Weight | Score |
|---|---|---|---|---|---|
| Interior | Info channels | 3,966.9 | 77.00 | 10 | 192.49 |
| Interior | Direct lighting | 946.5 | 53.18 | 40 | 531.75 |
| Interior | Path tracing | 432.8 | 50.69 | 50 | 633.56 |
| Idea | Info channels | 4,135.1 | 48.09 | 10 | 120.22 |
| Idea | Direct lighting | 895.6 | 42.55 | 40 | 425.47 |
| Idea | Path tracing | 775.5 | 40.02 | 50 | 500.22 |
| ATV | Info channels | 3,828.8 | 121.98 | 10 | 304.94 |
| ATV | Direct lighting | 848.3 | 55.77 | 40 | 557.74 |
| ATV | Path tracing | 740.3 | 57.30 | 50 | 716.19 |
| Box | Info channels | 4,321.5 | 65.73 | 10 | 164.31 |
| Box | Direct lighting | 674.2 | 48.71 | 40 | 487.13 |
| Box | Path tracing | 563.4 | 41.89 | 50 | 523.63 |
| Scene | Kernel | Ms/s | ×GTX 980 | Weight | Score |
|---|---|---|---|---|---|
| Interior | Info channels | 5,236.2 | 101.63 | 10 | 254.09 |
| Interior | Direct lighting | 1,253.9 | 70.44 | 40 | 704.42 |
| Interior | Path tracing | 573.9 | 67.20 | 50 | 840.02 |
| Idea | Info channels | 5,446.9 | 63.34 | 10 | 158.36 |
| Idea | Direct lighting | 1,190.2 | 56.54 | 40 | 565.44 |
| Idea | Path tracing | 1,032.0 | 53.25 | 50 | 665.63 |
| ATV | Info channels | 5,075.6 | 161.69 | 10 | 404.24 |
| ATV | Direct lighting | 1,124.7 | 73.94 | 40 | 739.44 |
| ATV | Path tracing | 984.4 | 76.19 | 50 | 952.40 |
| Box | Info channels | 5,725.8 | 87.08 | 10 | 217.71 |
| Box | Direct lighting | 902.6 | 65.22 | 40 | 652.19 |
| Box | Path tracing | 751.9 | 55.91 | 50 | 698.81 |
Reading across the four tables, the per-scene Ms/s rises almost in lockstep with GPU count. Take ATV path tracing: 249.2, 494.7, 740.3, 984.4 Ms/s from one to four cards, which is 1.00x, 1.99x, 2.97x, 3.95x. The heaviest kernel scales as cleanly as the total does, which is the real signal that no single scene is bottlenecking on the design.
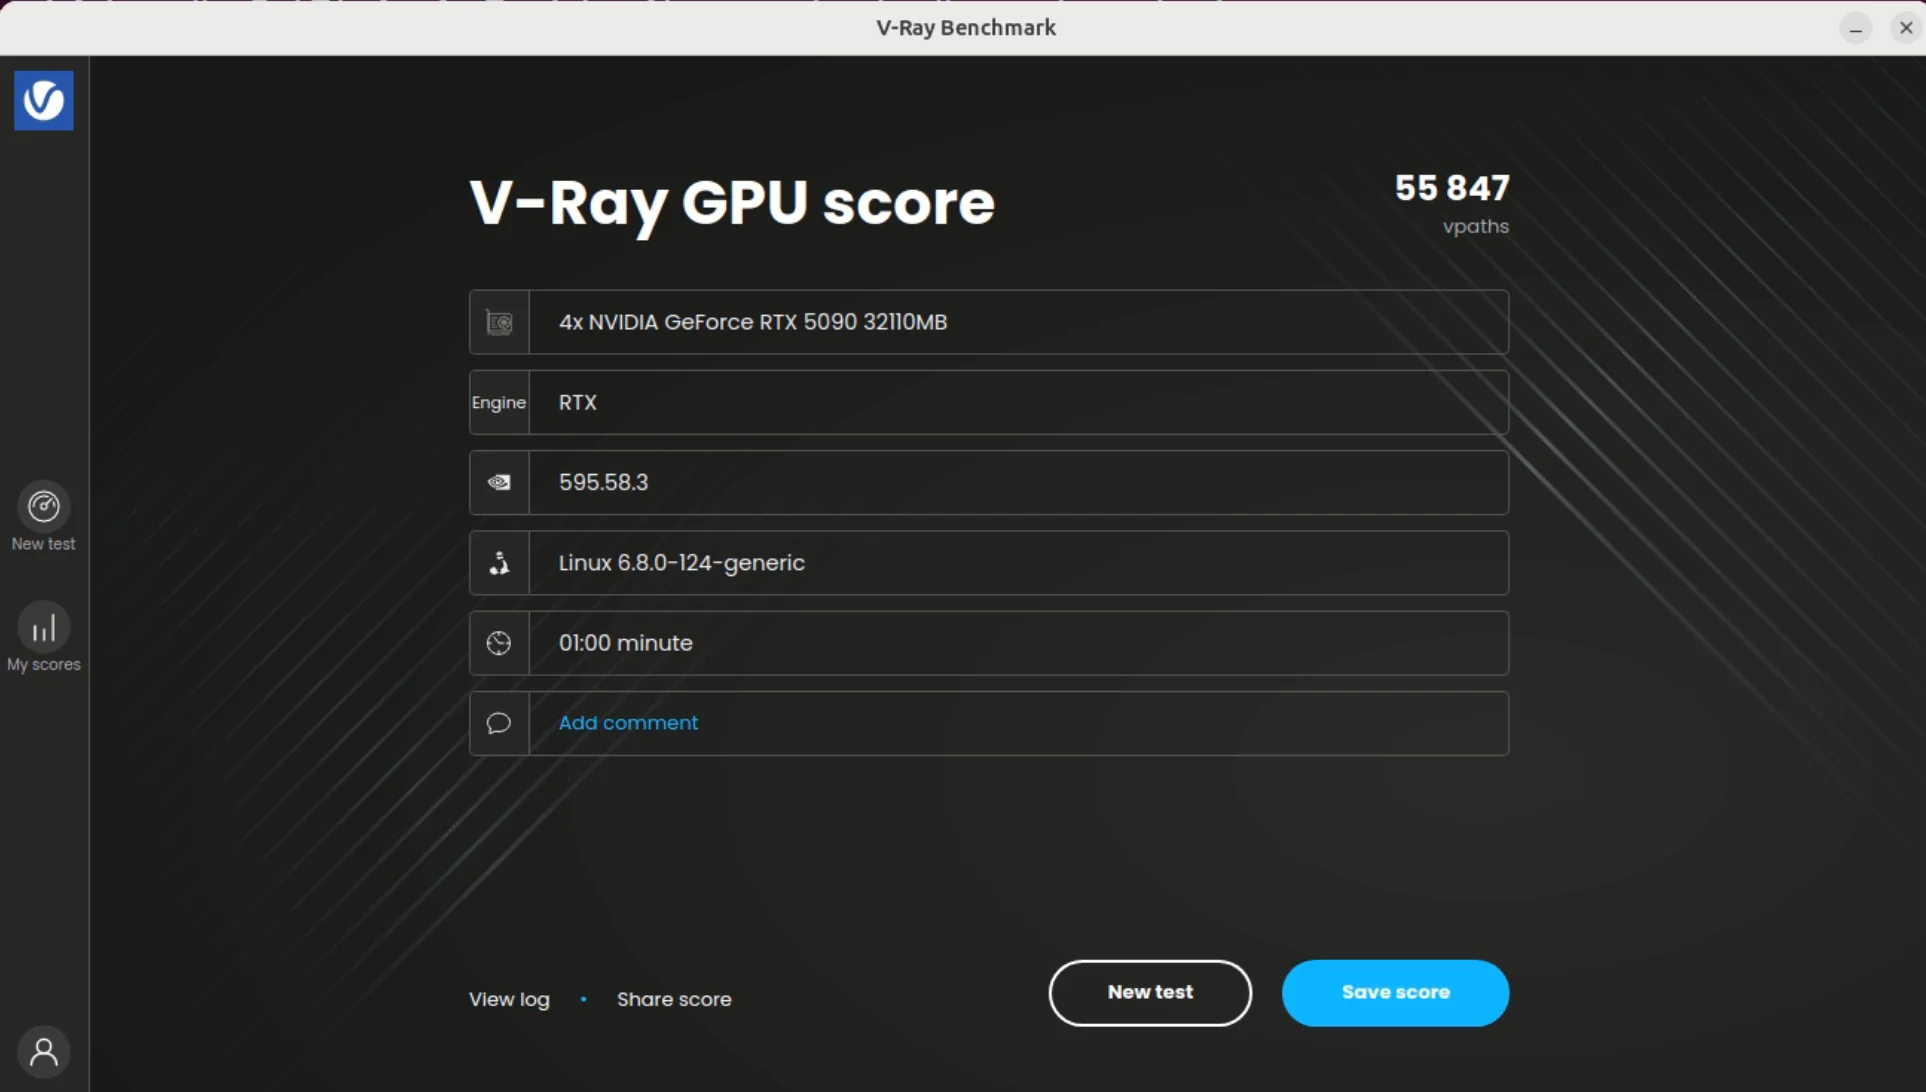
V-Ray gives us three separate numbers: the GPU running on the CUDA engine, the GPU running on the RTX (hardware ray tracing) engine, and the CPU.
| Test | Engine | Result |
|---|---|---|
| 4x RTX 5090 | RTX | 55,847 vpaths |
| 4x RTX 5090 | CUDA | 49,966 vpaths |
| Single RTX 5090 | RTX | ~16,000 vpaths |
| EPYC 9554 (64C) | CPU | 116,613 vsamples |
The four cards on the RTX engine reach 55,847 vpaths, against roughly 16,000 for a single 5090 on the same engine. The GPU and CPU figures use different units (vpaths versus vsamples) and are not directly comparable to each other; both are listed because a real V-Ray pipeline can use either path.
Note on the CUDA figure: across our runs we recorded two CUDA results, 44,188 and 49,966 vpaths. We report the higher, repeatable run. The spread is a useful reminder that a one-minute benchmark has run-to-run variance, and any single screenshot should be read with that in mind.
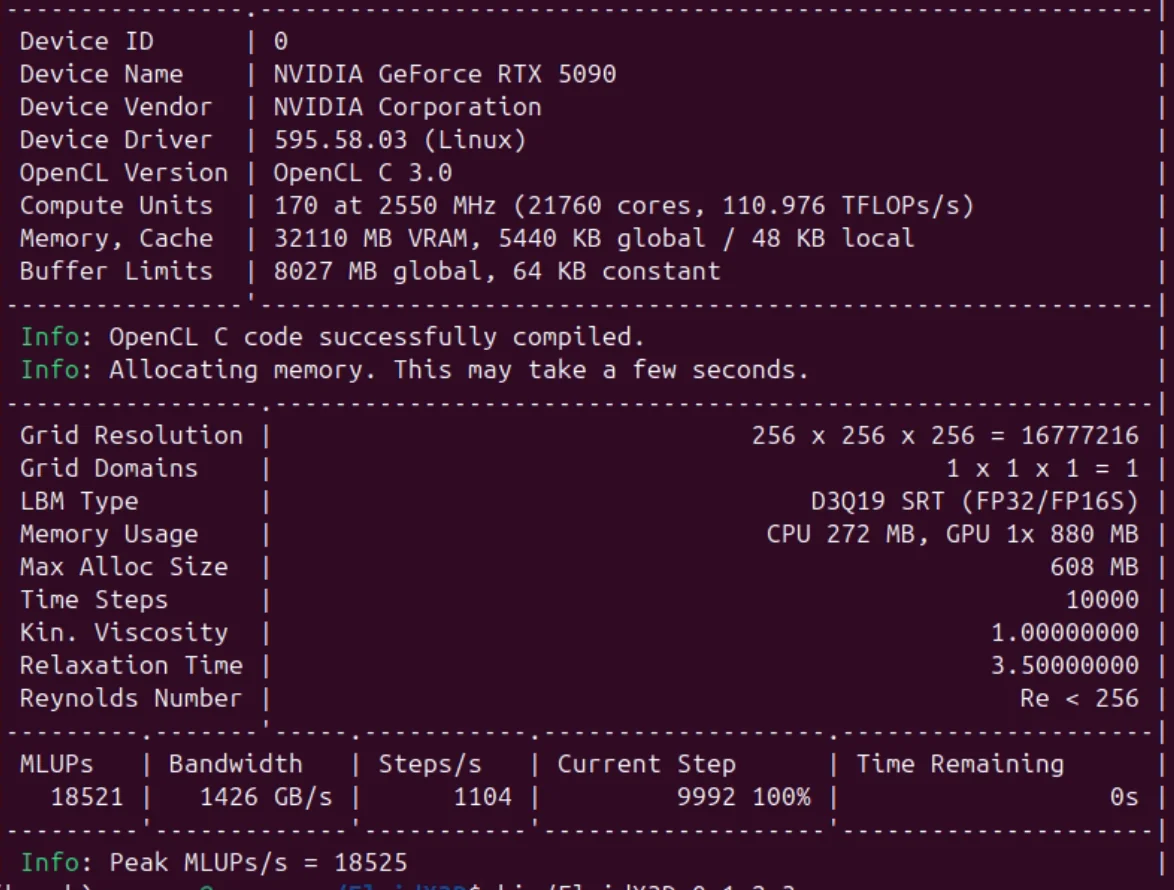
GPU rendering scales across cards because frames are independent. Simulation is the harder test, because a single fluid domain is one connected problem. We used FluidX3D Benchmark, an open-source Lattice Boltzmann (LBM) solver, and ran it twice: once on a single card, once across all four.
| Metric | Value |
|---|---|
| Grid | 256 x 256 x 256 = 16,777,216 cells |
| Domains | 1 |
| GPU memory used | 880 MB |
| Sustained throughput | 18,521 MLUPs |
| Peak throughput | 18,525 MLUPs |
| Memory bandwidth | 1,426 GB/s |
| Steps per second | 1,104 |
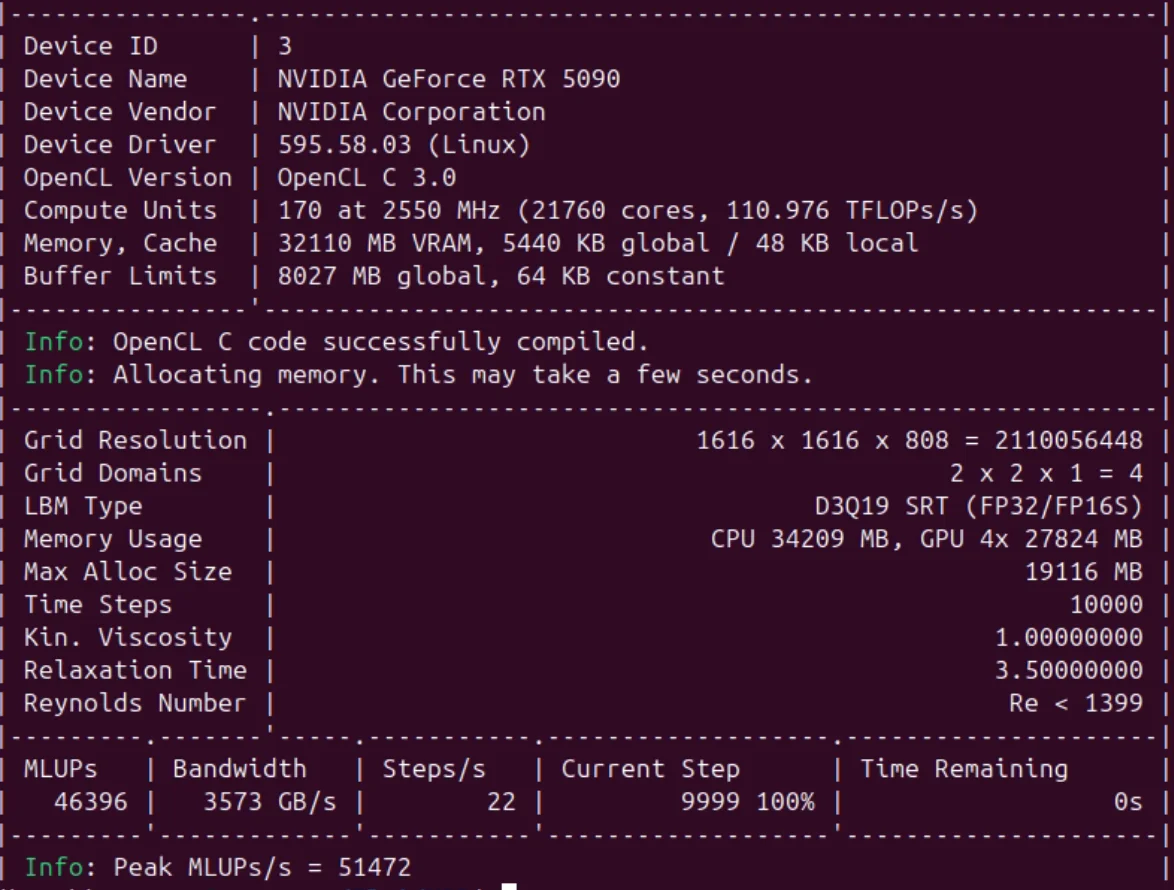
| Metric | Value |
|---|---|
| Grid | 1616 x 1616 x 808 = 2,110,056,448 cells |
| Domains | 2 x 2 x 1 = 4 (one per GPU) |
| GPU memory used | 4x 27,824 MB (~111 GB total) |
| Sustained throughput | 46,396 MLUPs |
| Peak throughput | 51,472 MLUPs |
| Memory bandwidth | 3,573 GB/s |
| Steps per second | 22 |
| Time steps completed | 10,000 |
The four-card run modelled 2.1 billion cells of moving fluid, a grid 126 times larger than the single-card test. That problem needs about 111 GB of memory, split across the four cards at roughly 28 GB each. No single GeForce card holds that much, so the simulation is only possible because the four cards pool their memory and work together. It ran the full 10,000 steps and peaked at over 51 billion cell updates per second at 3,573 GB/s of combined memory bandwidth.
Honest caveat: the single-GPU and four-GPU runs use different grid sizes, so these two results are not a clean 2.8x speedup comparison. The four-card story here is capacity, not raw scaling. The value is that the machine runs a class of simulation a single card physically cannot hold in memory. For LBM specifically, throughput is governed by memory bandwidth more than raw FLOPS, which is why the bandwidth figure, not the card's theoretical 111 TFLOPS, is the one that tracks the result.
This is where the four-independent-cards design either pays off or falls apart, and it is the section we tested hardest.
We served eight open models on vLLM with tensor parallelism across all four GPUs, then ran a concurrency sweep, pushing from 1 simultaneous user up to 1,024, and on the strongest models, 2,048. Every level used a 512-token max output, greedy decoding (temperature 0.0), and a warmup pass. The numbers that matter are aggregate throughput (total tokens per second the server produces) and per-user throughput (what each individual user actually experiences at that load), along with the failure count.
The eight models split into two groups. Mixture-of-Experts (MoE) models activate only part of their parameters per token and run faster. Dense models run all parameters every token and are heavier. Both are included because both are deployed in the real world.
With one user, the server is showing raw per-request speed.
| Model | Type | Tokens/sec |
|---|---|---|
| Qwen3.6 35B-A3B | MoE | 184 |
| Qwen3.5 9B | Dense | 183 |
| Gemma 4 26B-A4B | MoE | 177 |
| Gemma 4 E4B | MoE | 176 |
| gemma-3 27B | Dense | 67 |
| gemma-4 31B | Dense | 64 |
Two models, Nemotron Cascade 30B and Qwen3-Coder-Next, show an artificially low single-user row (8 and 15 tok/s) because the first request absorbed model cold-start. Their real per-request speed appears from two users onward (188 and 136 tok/s). We flag this rather than hide it; their full tables are below.
Every model, every concurrency level. Failed requests were zero at every level shown, on every model.
| Users | Agg tok/s | P50 lat (s) | P95 lat (s) | Tok/s per user |
|---|---|---|---|---|
| 1 | 184.0 | 2.78 | 2.78 | 184.0 |
| 2 | 301.2 | 3.39 | 3.40 | 150.9 |
| 4 | 541.1 | 3.78 | 3.78 | 135.6 |
| 8 | 983.5 | 4.16 | 4.16 | 123.2 |
| 16 | 1,549.1 | 5.27 | 5.28 | 97.1 |
| 32 | 2,501.1 | 6.51 | 6.53 | 78.7 |
| 64 | 3,475.9 | 9.34 | 9.38 | 54.8 |
| 128 | 4,501.2 | 14.37 | 14.48 | 35.7 |
| 512 | 5,335.6 | 36.64 | 48.31 | 15.4 |
| 1,024 | 5,254.9 | 61.88 | 97.87 | 10.3 |
Peak aggregate: 5,335.6 tok/s at 512 users. Max healthy concurrency: 1,024.
| Users | Agg tok/s | P50 lat (s) | P95 lat (s) | Tok/s per user |
|---|---|---|---|---|
| 1 | 183.5 | 2.79 | 2.79 | 183.5 |
| 2 | 304.8 | 3.36 | 3.36 | 152.6 |
| 4 | 593.3 | 3.45 | 3.45 | 148.7 |
| 8 | 1,113.7 | 3.67 | 3.67 | 139.6 |
| 16 | 1,891.8 | 4.32 | 4.33 | 118.6 |
| 32 | 2,953.9 | 5.52 | 5.53 | 92.8 |
| 64 | 3,687.3 | 8.80 | 8.85 | 58.2 |
| 128 | 4,734.2 | 13.59 | 13.72 | 37.6 |
| 512 | 4,940.3 | 39.26 | 52.30 | 14.6 |
| 1,024 | 4,949.9 | 65.40 | 104.20 | 10.1 |
| 2,048 | 1,662.9 | 128.19 | 208.63 | 4.9 |
Peak aggregate: 4,949.9 tok/s at 1,024 users. Max healthy concurrency: 2,048 (0 failures).
| Users | Agg tok/s | P50 lat (s) | P95 lat (s) | Tok/s per user |
|---|---|---|---|---|
| 1 | 177.7 | 2.88 | 2.88 | 177.7 |
| 2 | 296.9 | 3.44 | 3.45 | 148.7 |
| 4 | 504.7 | 4.05 | 4.06 | 126.4 |
| 8 | 887.0 | 4.61 | 4.61 | 111.2 |
| 16 | 1,406.8 | 5.80 | 5.81 | 88.3 |
| 32 | 2,197.4 | 7.43 | 7.44 | 69.0 |
| 64 | 3,187.3 | 10.19 | 10.25 | 50.3 |
| 128 | 4,165.0 | 15.50 | 15.59 | 33.0 |
| 512 | 4,959.2 | 39.09 | 52.04 | 14.6 |
| 1,024 | 5,028.6 | 64.17 | 102.47 | 10.3 |
Peak aggregate: 5,028.6 tok/s at 1,024 users. Max healthy concurrency: 1,024.
| Users | Agg tok/s | P50 lat (s) | P95 lat (s) | Tok/s per user |
|---|---|---|---|---|
| 1 | 176.3 | 2.90 | 2.90 | 176.3 |
| 2 | 300.8 | 3.40 | 3.40 | 150.7 |
| 4 | 642.2 | 3.18 | 3.19 | 160.9 |
| 8 | 1,141.1 | 3.58 | 3.59 | 143.0 |
| 16 | 2,015.6 | 4.05 | 4.06 | 126.6 |
| 32 | 3,112.0 | 5.25 | 5.26 | 97.6 |
| 64 | 4,218.0 | 7.71 | 7.74 | 66.5 |
| 128 | 5,123.2 | 12.59 | 12.71 | 40.9 |
| 512 | 5,669.7 | 33.40 | 45.42 | 16.5 |
| 1,024 | 5,678.3 | 56.81 | 90.45 | 11.3 |
Peak aggregate: 5,678.3 tok/s at 1,024 users.
| Users | Agg tok/s | P50 lat (s) | P95 lat (s) | Tok/s per user |
|---|---|---|---|---|
| 1 | 66.6 | 7.69 | 7.69 | 66.6 |
| 2 | 119.1 | 8.58 | 8.60 | 59.7 |
| 4 | 234.7 | 8.72 | 8.73 | 58.8 |
| 8 | 444.4 | 9.21 | 9.21 | 55.6 |
| 16 | 770.2 | 10.62 | 10.63 | 48.2 |
| 32 | 1,251.9 | 13.06 | 13.07 | 39.2 |
| 64 | 1,628.2 | 20.03 | 20.08 | 25.6 |
| 128 | 2,230.4 | 29.10 | 29.23 | 17.6 |
| 512 | 2,002.8 | 96.33 | 128.55 | 6.5 |
| 1,024 | 2,043.2 | 163.96 | 247.22 | 4.5 |
Peak aggregate: 2,230.4 tok/s at 128 users. Max healthy concurrency: 1,024.
| Users | Agg tok/s | P50 lat (s) | P95 lat (s) | Tok/s per user |
|---|---|---|---|---|
| 1 | 64.4 | 7.96 | 7.96 | 64.4 |
| 2 | 122.9 | 8.32 | 8.33 | 61.6 |
| 4 | 239.7 | 8.53 | 8.54 | 60.0 |
| 8 | 448.4 | 9.13 | 9.13 | 56.1 |
| 16 | 756.3 | 10.82 | 10.83 | 47.4 |
| 32 | 1,189.2 | 13.75 | 13.76 | 37.3 |
| 64 | 1,596.0 | 20.44 | 20.49 | 25.1 |
| 128 | 1,903.9 | 30.31 | 33.90 | 16.6 |
| 512 | 2,037.1 | 90.66 | 127.22 | 6.7 |
| 1,024 | 1,982.9 | 150.29 | 262.39 | 4.5 |
Peak aggregate: 2,037.1 tok/s at 512 users. Max healthy concurrency: 1,024.
| Users | Agg tok/s | P50 lat (s) | P95 lat (s) | Tok/s per user |
|---|---|---|---|---|
| 1 | 8.3 | 61.74 | 61.74 | 8.3 (cold start) |
| 2 | 375.8 | 2.72 | 2.72 | 188.3 |
| 4 | 661.3 | 3.09 | 3.09 | 165.7 |
| 8 | 1,111.4 | 3.68 | 3.68 | 139.4 |
| 16 | 1,644.8 | 4.97 | 4.97 | 103.2 |
| 32 | 2,258.9 | 7.22 | 7.24 | 71.0 |
| 64 | 3,741.7 | 8.67 | 8.71 | 59.0 |
| 128 | 2,322.5 | 27.97 | 28.08 | 18.3 |
| 512 | 6,803.5 | 28.56 | 37.86 | 20.1 |
| 1,024 | 6,748.7 | 48.02 | 75.91 | 13.6 |
| 2,048 | 6,740.4 | 83.79 | 149.52 | 6.7 |
Peak aggregate: 6,803.5 tok/s at 512 users. Max healthy concurrency: 2,048 (0 failures).
| Users | Agg tok/s | P50 lat (s) | P95 lat (s) | Tok/s per user |
|---|---|---|---|---|
| 1 | 15.5 | 33.14 | 33.14 | 15.5 (cold start) |
| 2 | 272.4 | 3.75 | 3.76 | 136.5 |
| 4 | 477.2 | 4.29 | 4.29 | 119.5 |
| 8 | 434.3 | 9.42 | 9.43 | 54.4 |
| 16 | 1,424.0 | 5.73 | 5.74 | 89.4 |
| 32 | 2,376.4 | 6.86 | 6.88 | 74.7 |
| 64 | 3,399.5 | 9.55 | 9.60 | 53.7 |
| 128 | 4,224.1 | 15.28 | 15.36 | 33.5 |
| 512 | 5,663.4 | 34.31 | 45.53 | 16.7 |
| 1,024 | 5,700.4 | 56.63 | 90.32 | 11.7 |
| 2,048 | 5,639.1 | 100.18 | 179.47 | 5.7 |
Peak aggregate: 5,700.4 tok/s at 1,024 users. Max healthy concurrency: 2,048 (0 failures).
Two findings stand out.
First, at 1,024 concurrent users, the MoE models stayed genuinely usable per person. Nemotron held 13.6 tok/s for each of 1,024 users, Qwen3-Coder-Next 11.7, Gemma 4 E4B 11.3, Qwen3.6 35B and Gemma 4 26B 10.3 each, Qwen3.5 9B 10.1. Reading speed is roughly 5 to 8 tokens per second, so every one of those thousand users was still getting output faster than they could read it, with zero failed requests.
Second, the 2,048-user runs. We pushed Nemotron and Qwen3-Coder-Next to two thousand simultaneous requests and saw zero failures, with Nemotron sustaining over 6,800 tok/s of aggregate throughput. That is the result we re-ran three times before we believed it. Per-user speed at that load drops to 6.7 and 5.7 tok/s, which is the point where you would add a second server rather than push one harder, but the machine did not fall over.
The dense models (gemma-3 27B, gemma-4 31B) are the honest counterweight: they top out around 2,000 tok/s aggregate and degrade to ~4.5 tok/s per user at 1,024 concurrent. Dense models are heavier, and if your workload is dense and high-concurrency, plan capacity accordingly. The MoE results are where this configuration is at its best.
A note on memory: at 32 GB per card, the model has to fit in 32 GB per GPU (with tensor parallelism splitting larger models across the four). Every model here fit. If yours needs more than 32 GB per card, this is the wrong machine, and our RTX Pro 6000 or H200 servers are the right one.
A GPU server still lives or dies on the host CPU when a workload hits a serial section, loads scenes, or feeds data to the cards. The EPYC 9554 was measured in PassMark PerformanceTest 11.
| Metric | Result |
|---|---|
| CPU Mark | 102,965 |
| Integer Math | 615,650 MOps/s |
| Floating Point Math | 344,945 MOps/s |
| Prime Numbers | 824 M primes/s |
| Sorting | 201,521 K strings/s |
| Encryption | 149,485 MB/s |
| Compression | 2,321,966 KB/s |
| Single Threaded | 2,937 MOps/s |
| Physics | 7,388 frames/s |
| Extended Instructions (SSE) | 146,699 M matrices/s |
| Memory Mark | 3,113 |
| Database Operations | 26,552 K ops/s |
| Memory Read (cached) | 27,955 MB/s |
| Memory Read (uncached) | 27,765 MB/s |
| Memory Write | 25,698 MB/s |
| Memory Latency | 67 ns |
| Memory (threaded) | 221,510 MB/s |
The V-Ray CPU result above (116,613 vsamples) is the rendering-relevant CPU figure; PassMark gives the general-purpose picture. For a host feeding four GPUs, the numbers that matter most are the high threaded memory bandwidth (221 GB/s) and strong multi-core integer and floating-point throughput, both of which keep the cards fed rather than waiting.
The measurements spec sheets avoid, taken at the wall and at the sensors, in an open ambient near 25 °C.
| State | Draw |
|---|---|
| Idle | 420 W |
| CPU fully loaded | 770 W |
| CPU + all 4 GPUs loaded | 3,280 W |
A combined-load draw of 3,280 W is the planning number. This is more than a standard 15 A wall circuit delivers in many regions, so the room and the power feed are part of the install, not an afterthought. We size that with you.
| Sensor | Under load |
|---|---|
| GPUs (at 100% utilization) | 61 to 64 °C |
| GPUs (idle) | 32 to 34 °C |
| CPU (Tctl) | 85.6 °C |
| CPU (per-CCD, Tccd1-8) | 78.2 to 85.2 °C |
| NVMe drives | 27.9 to 40.9 °C |
This is the result the design was built to deliver. Four 575 W desktop cards held between 61 and 64 °C at full utilization, well inside their thermal limits, with no throttling. The OctaneBench 3.94x scaling figure is the proof in a different form: if the cards were throttling under combined load, that number would have collapsed toward 3.0 or lower. It did not.
A machine that runs renders and training jobs that take hours cannot fail silently mid-job. The GQ-A is built to keep running:
Redundant (1+1) power supplies mean that if one PSU fails, the other carries the full load with no downtime. Drives are hot-swap, replaceable while the system is live, alongside high-RPM cooling. Full remote management allows reboot and monitoring from anywhere. And if hardware does fail, we provide next-business-day onsite service across India through a network of over 7,500 certified technicians.
This server is built for one thing: the most GPU performance you can buy per rupee, for work that runs across several cards at once.
The benchmarks back the design claim. GPU rendering scales at 3.94x across four cards with no thermal penalty. A 2.1 billion-cell CFD simulation that no single GeForce card can hold ran across the four cards' pooled 111 GB of memory. And on AI inference, the machine served over a thousand concurrent users at usable per-person speeds and survived two thousand simultaneous requests without a single failure, all while holding the GPUs in the low 60s °C.
It fits two kinds of teams. Studios can run it as a shared render node for V-Ray, Octane, or Redshift, or distribute its compute across an artist team so several people draw GPU power from one rackmount machine instead of four towers under four desks. AI teams can serve open models to a whole company from the same four cards, as long as the model fits in 32 GB each.
It is the wrong machine for one job: training large models, or running any single model that needs more than 32 GB per card, or jobs that depend on constant GPU-to-GPU communication. For those, NVLink and HBM win, and our RTX Pro 6000 and H200 servers are built for exactly that.
Whether you render, simulate, or serve models, this is built to perform when the deadline hits. If you have questions, or want it configured for your exact workload, our team is ready to help.
[Configure the Pro Maestro GQ-A] | [Talk to our team]
All benchmarks were run in-house on a single Pro Maestro GQ-A unit. GPU pricing references reflect current market conditions and will vary by region and over time.
Resources you may find helpful.
ProX PC Maestro Servers offer the powerful GPUs, ample memory, and scalable features needed to supercharge your deep learning projects.

ProX PC servers offer top performance, scalability, and reliability for big data and deep learning, making them ideal for various industries. Invest smartly with ProX PC.

Discover the future of AI with ProX PC's 8 GPU servers featuring NVIDIA RTX 4090 GPUs. Unmatched performance, reliability, and scalability for all your machine learning needs.
In the fast-evolving world of computational technology, choosing the right hardware can significantly impact the performance of scientific and engineering workloads. In this post, we will compare the numerical computing performance of the new AMD Zen4 Threadripper PRO (specifically the 7995WX and 7985WX) against the Intel Xeon W-9 3495X and the older Threadripper 7980X. We will also briefly mention the previous generation Threadripper PRO 5995WX with Zen3 optimizations.